Global Spine Surgical Procedure Volumes (SPV) Database
LSI's Global Surgical Procedure Volumes Database is a powerful resource for medtech and healthcare companies
seeking to gain a deeper understanding of trends in surgical procedure volumes. The Spine Surgery segment is one
of 13 procedure markets that we've subdivided the database into to facilitate trends across major types of
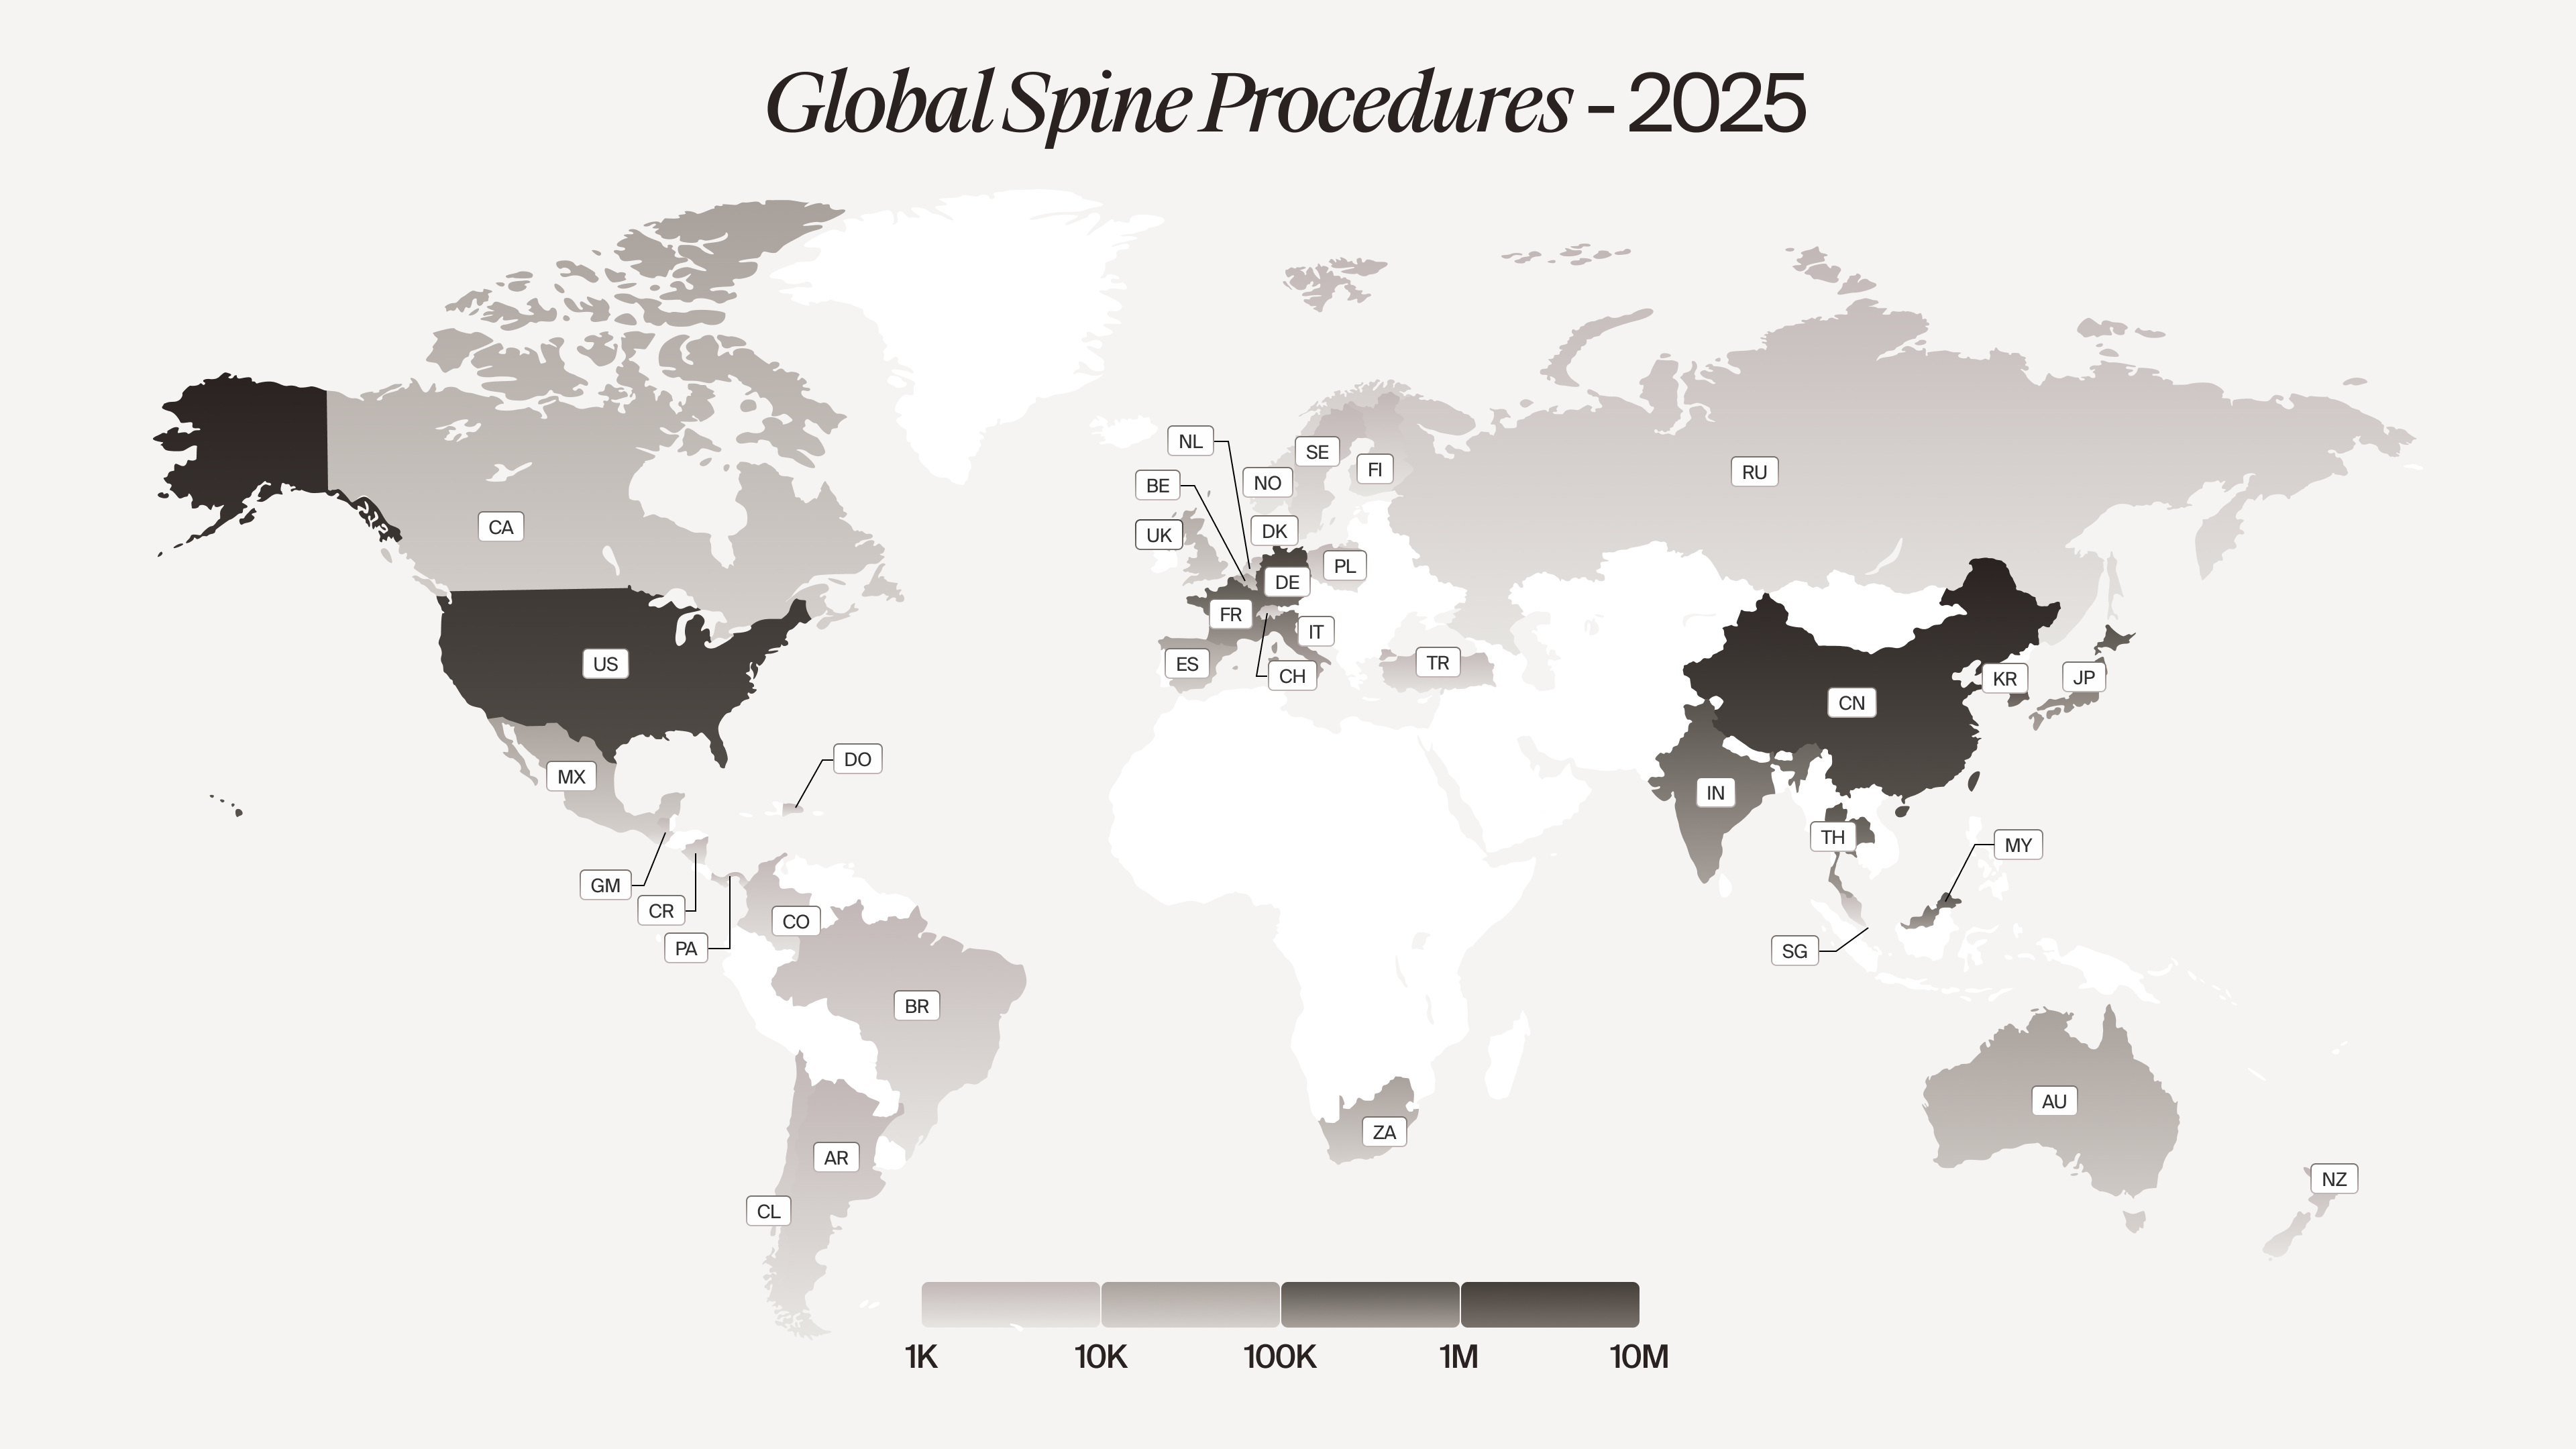
procedures. This detailed database offers extensive data on procedure volumes, growth forecasts, and market
shifts across 37 countries, helping you make data-driven decisions and stay ahead of trends.
Within the platform, users can view procedure volumes for each spine procedure globally or segmented by country.
This feature provides a comprehensive view of the data and allows for granular insights into both regional and
global surgical trends.
Procedures covered in our Spine Surgical Procedure Volume Database include:
Cervical Spine Decompressions
Cervical Spine Discectomies
Cervical Spine Fusions
Cervical Spine Disc Replacements
Thoracic Spine Decompressions
Thoracic Spine Discectomies
Insertion of Lumbar Interspinous Process Spacer
Lumbar Spine Disc Replacements
Thoracic Spine Fusions
Instrumented Procedures for Deformities
Lumbar Spine Decompressions
Lumbar Spine Discectomies
Lumbar Spine Fusions
Vertebroplasties
Kyphoplasties
Facet Joint Denervations
Global Spine Surgical Procedure Volumes
| Procedures in 2024 (000s) | CAGR (2023-2030) | |
| Global | 9,018 | 3.23% |
| United States | 1,655 | 2.65% |
| Canada | 89.79 | 1.85% |
| Germany | 833.76 | 2.04% |
| China | 3,951 | 13.53% |
| Mexico | 67.15 | 4.02% |
| Switzerland | 34.01 | 2.76% |
| Spain | 89.99 | 4.76% |
| United Kingdom | 93.33 | 3.46% |
| Italy | 89.46 | 2.29% |
| France | 211.33 | 6.26% |
| Poland | 42.50 | 5.12% |
| Belgium | 66.88 | 3.88% |
| Denmark | 26.96 | 2.78% |
| Finland | 26.97 | 2.77% |
| Sweden | 43.96 | 5.24% |
| Norway | 13.88 | 3.90% |
| Netherlands | 31.45 | 1.72% |
| Japan | 365.43 | 3.02% |
| Russia | 13.10 | 5.19% |
| Turkey | 38.12 | 8.43% |
| Malaysia | 116.08 | 3.78% |
| Thailand | 145.77 | 4.07% |
| Singapore | 28.88 | 5.70% |
| South Korea | 486.38 | 4.14% |
| India | 239.69 | 5.83% |
| Brazil | 38.45 | 3.15% |
| Colombia | 8.45 | 1.56% |
| Argentina | 7.25 | 1.80% |
| Chile | 3.69 | 1.98% |
| South Africa | 52.40 | 6.64% |
| Australia | 77.46 | 5.20% |
| New Zealand | 11.24 | 4.58% |
| Guatemala | 2.83 | 2.71% |
| Panama | 0.96 | 3.44% |
| Costa Rica | 3.62 | 3.90% |
| Dominican Republic | 2.04 | 2.56% |
| Caribbean | 8.14 | 1.82% |