Global Peripheral Vascular Surgical Procedure Volumes (SPV) Database
LSI's Global Surgical Procedure Volumes Database is a powerful resource for medtech and healthcare companies
seeking to gain a deeper understanding of trends in surgical procedure volumes. The Peripheral Vascular Surgery
segment is one of 13 procedure markets that we've subdivided the database into to facilitate trends across major
types of procedures. This detailed database offers extensive data on procedure volumes, growth forecasts, and
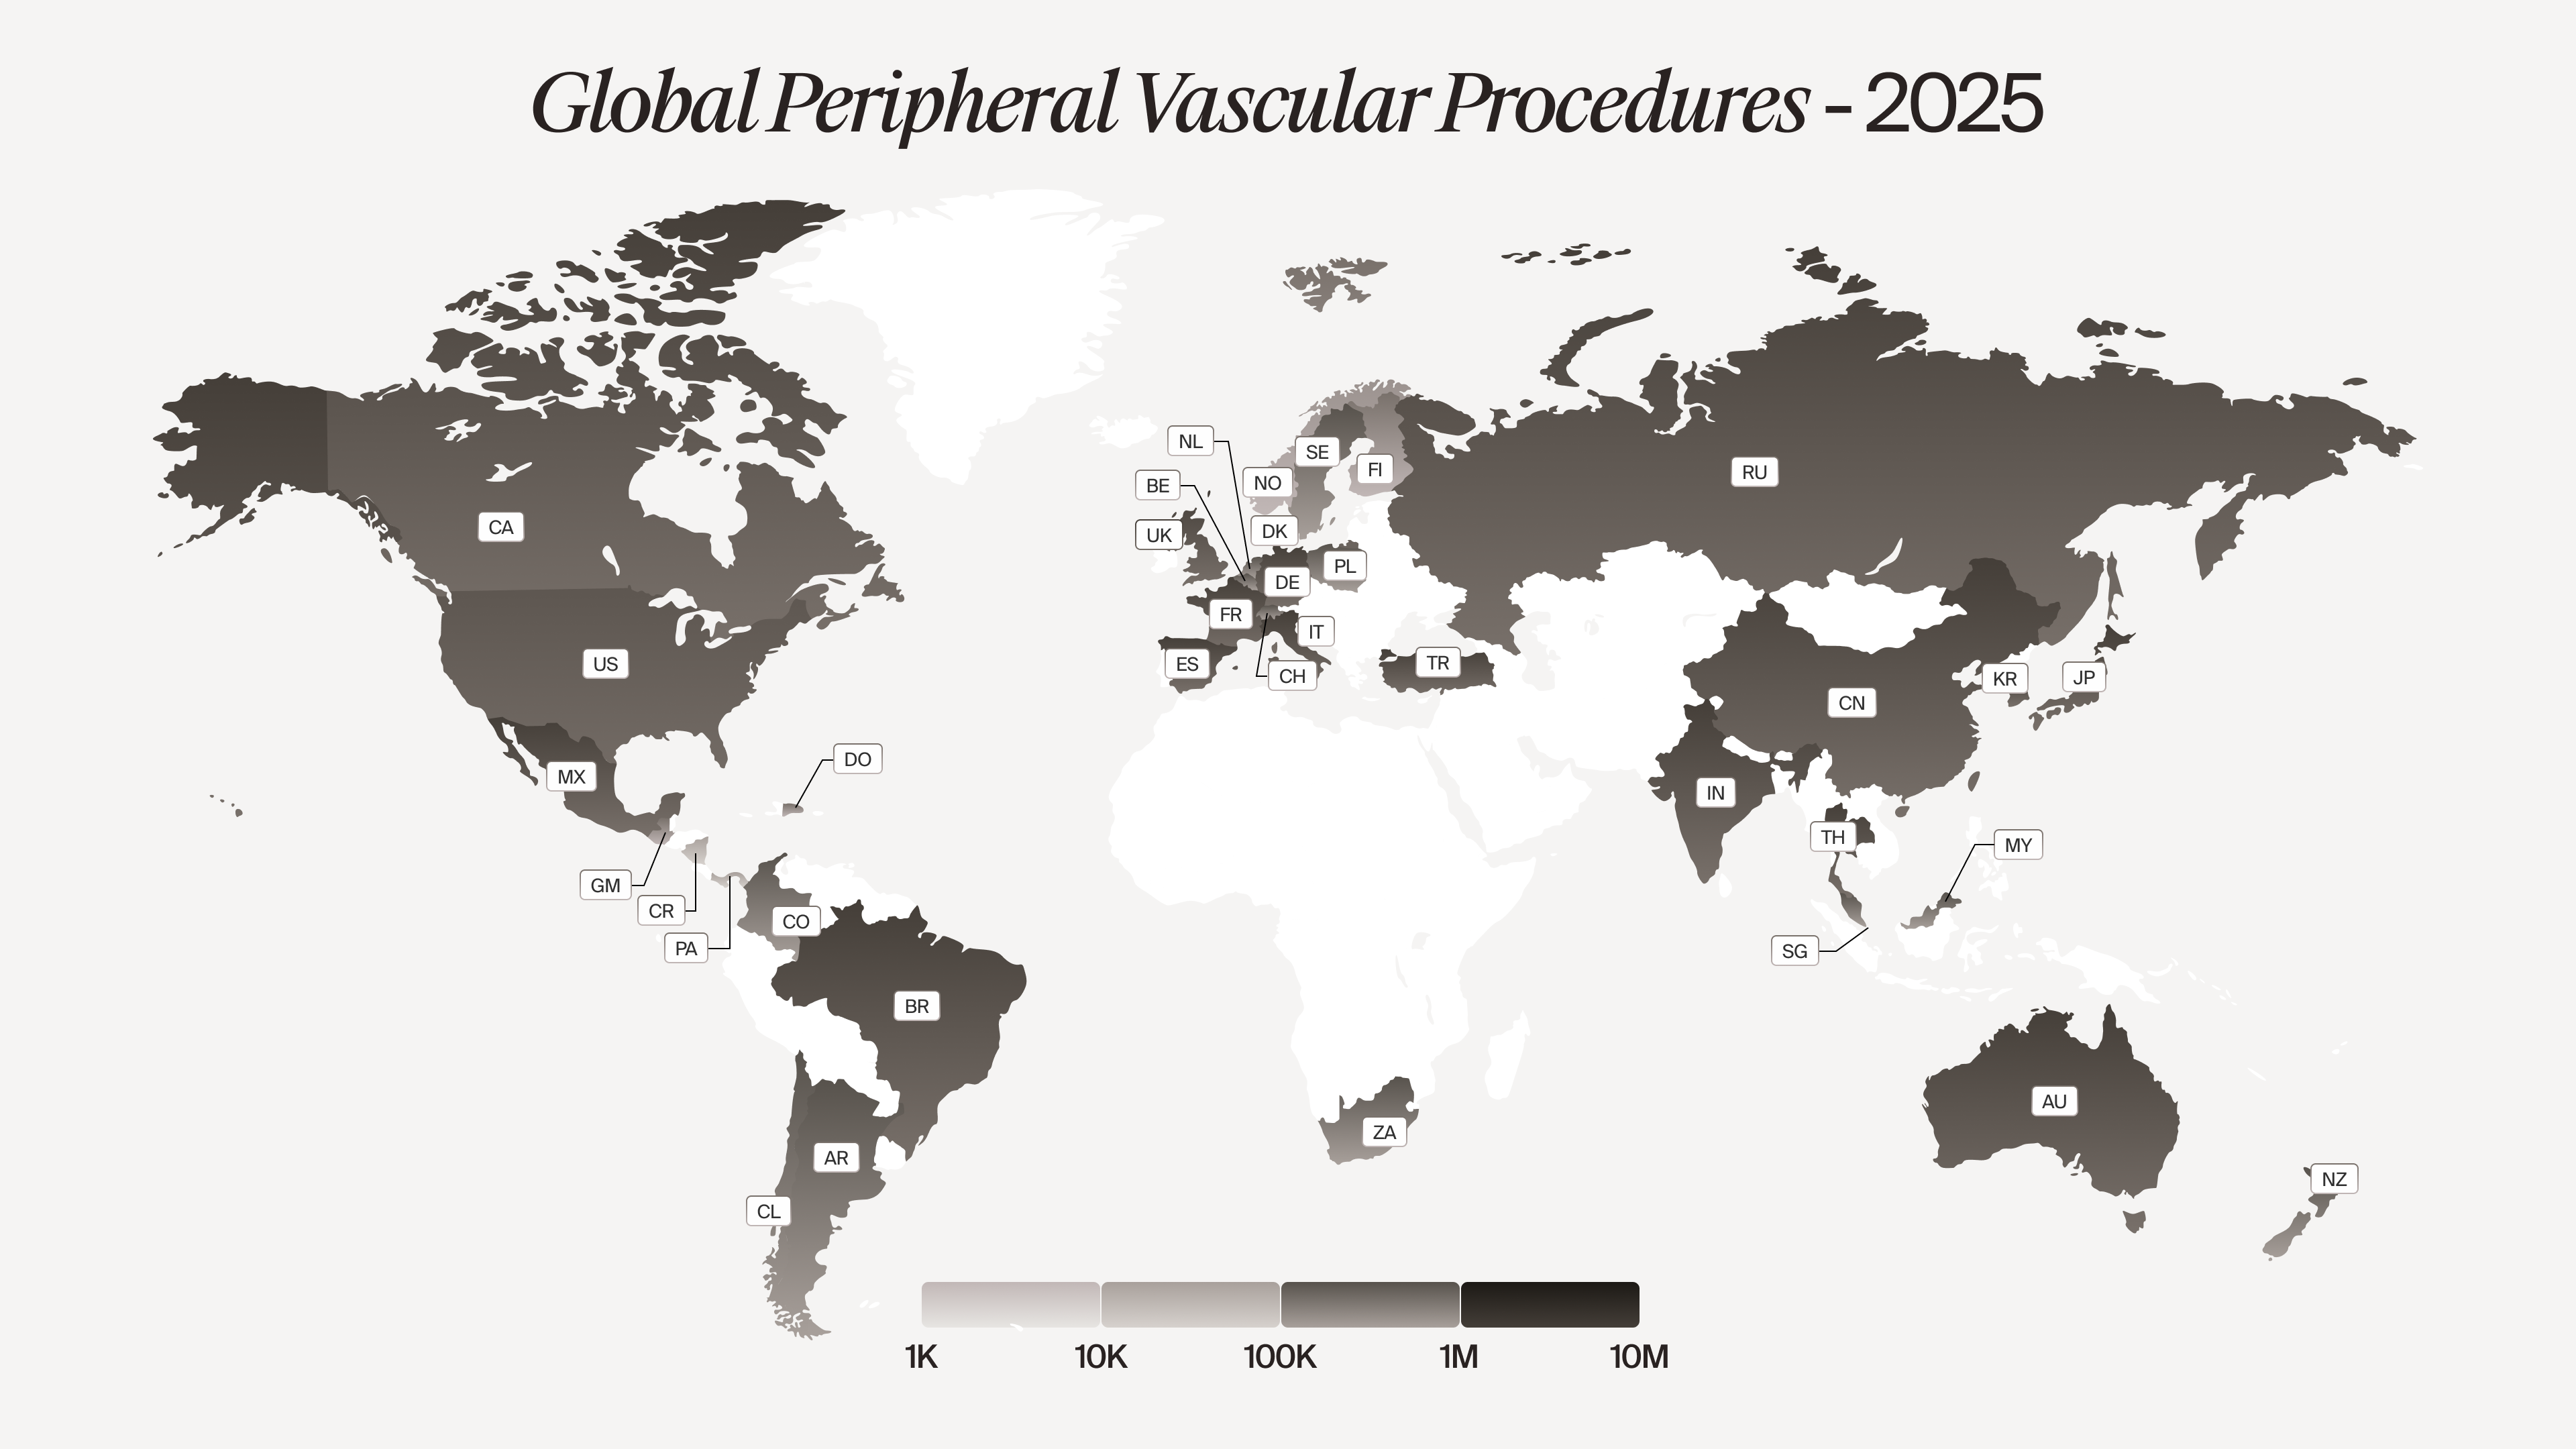
market shifts across 37 countries, helping you make data-driven decisions and stay ahead of trends.
Within the platform, users can view procedure volumes for each peripheral vascular procedure globally or
segmented by country. This feature provides a comprehensive view of the data and allows for granular insights
into both regional and global surgical trends.
Procedures covered in our Peripheral Vascular Surgical Procedure Volume Database include:
Carotid Artery Thrombectomies
Upper Limb Artery Thrombectomies
Iliac Artery Thrombectomies
Renal Artery Thrombectomies
Lower Limb Artery Thrombectomies
Carotid Artery Angioplasties
Iliac Artery Bypasses
Renal Artery Bypasses
Aortofemoral and Aortobifemoral Bypasses
Femoropopliteal Bypasses
Femorotibeal Bypasses
Other Lower Limb Bypasses
Head Neck Upper Limb Thrombectomies Thromboendarterectomies
Upper Limb Artery Angioplasties
Iliac Artery Angioplasties
Renal Artery Angioplasties
Lower Limb Artery Angioplasties
Carotid Artery Bypasses
Upper Limb Artery Bypasses
Head Neck Upper Limb Angioplasties
Removals of the Saphenous Vein
Removals of Other Veins of the Lower Limbs
Global Peripheral Vascular Surgical Procedure Volumes
| Procedures in 2024 (000s) | CAGR (2023-2030) | |
| Global | 5,163 | 1.24% |
| United States | 811.69 | -1.53% |
| Canada | 73.05 | 1.75% |
| Germany | 568.14 | 2.62% |
| China | 767.85 | 5.77% |
| Mexico | 89.65 | 5.99% |
| Switzerland | 11.68 | 0.81% |
| Spain | 184.99 | 4.77% |
| United Kingdom | 74.67 | 1.58% |
| Italy | 146.21 | 1.41% |
| France | 258.82 | 1.90% |
| Poland | 57.43 | 2.38% |
| Belgium | 43.75 | 3.84% |
| Denmark | 7.86 | 2.36% |
| Finland | 7.07 | 1.63% |
| Sweden | 35.01 | 3.00% |
| Norway | 7.51 | 0.03% |
| Netherlands | 26.29 | 1.82% |
| Japan | 219.40 | 3.59% |
| Russia | 345.23 | 5.05% |
| Turkey | 98.85 | 3.73% |
| Malaysia | 45.62 | 5.57% |
| Thailand | 89.78 | 5.07% |
| Singapore | 22.90 | 6.87% |
| South Korea | 133.74 | 4.15% |
| India | 637.80 | 3.72% |
| Brazil | 128.28 | 5.04% |
| Colombia | 37.54 | 3.48% |
| Argentina | 26.38 | 1.34% |
| Chile | 29.71 | 0.89% |
| South Africa | 39.20 | 4.16% |
| Australia | 82.27 | 1.78% |
| New Zealand | 12.49 | 2.82% |
| Guatemala | 9.26 | 3.62% |
| Panama | 2.14 | 3.39% |
| Costa Rica | 2.50 | 2.91% |
| Dominican Republic | 7.02 | 3.41% |
| Caribbean | 21.68 | 3.58% |