Global Neurosurgical Procedure Volumes (SPV) Database
LSI's Global Surgical Procedure Volumes Database is a powerful resource for medtech and healthcare companies
seeking to gain a deeper understanding of trends in surgical procedure volumes. The Neurosurgery segment is one
of 13 procedure markets that we've subdivided the database into to facilitate trends across major types of
procedures. This detailed database offers extensive data on procedure volumes, growth forecasts, and market
shifts across 37 countries, helping you make data-driven decisions and stay ahead of trends.
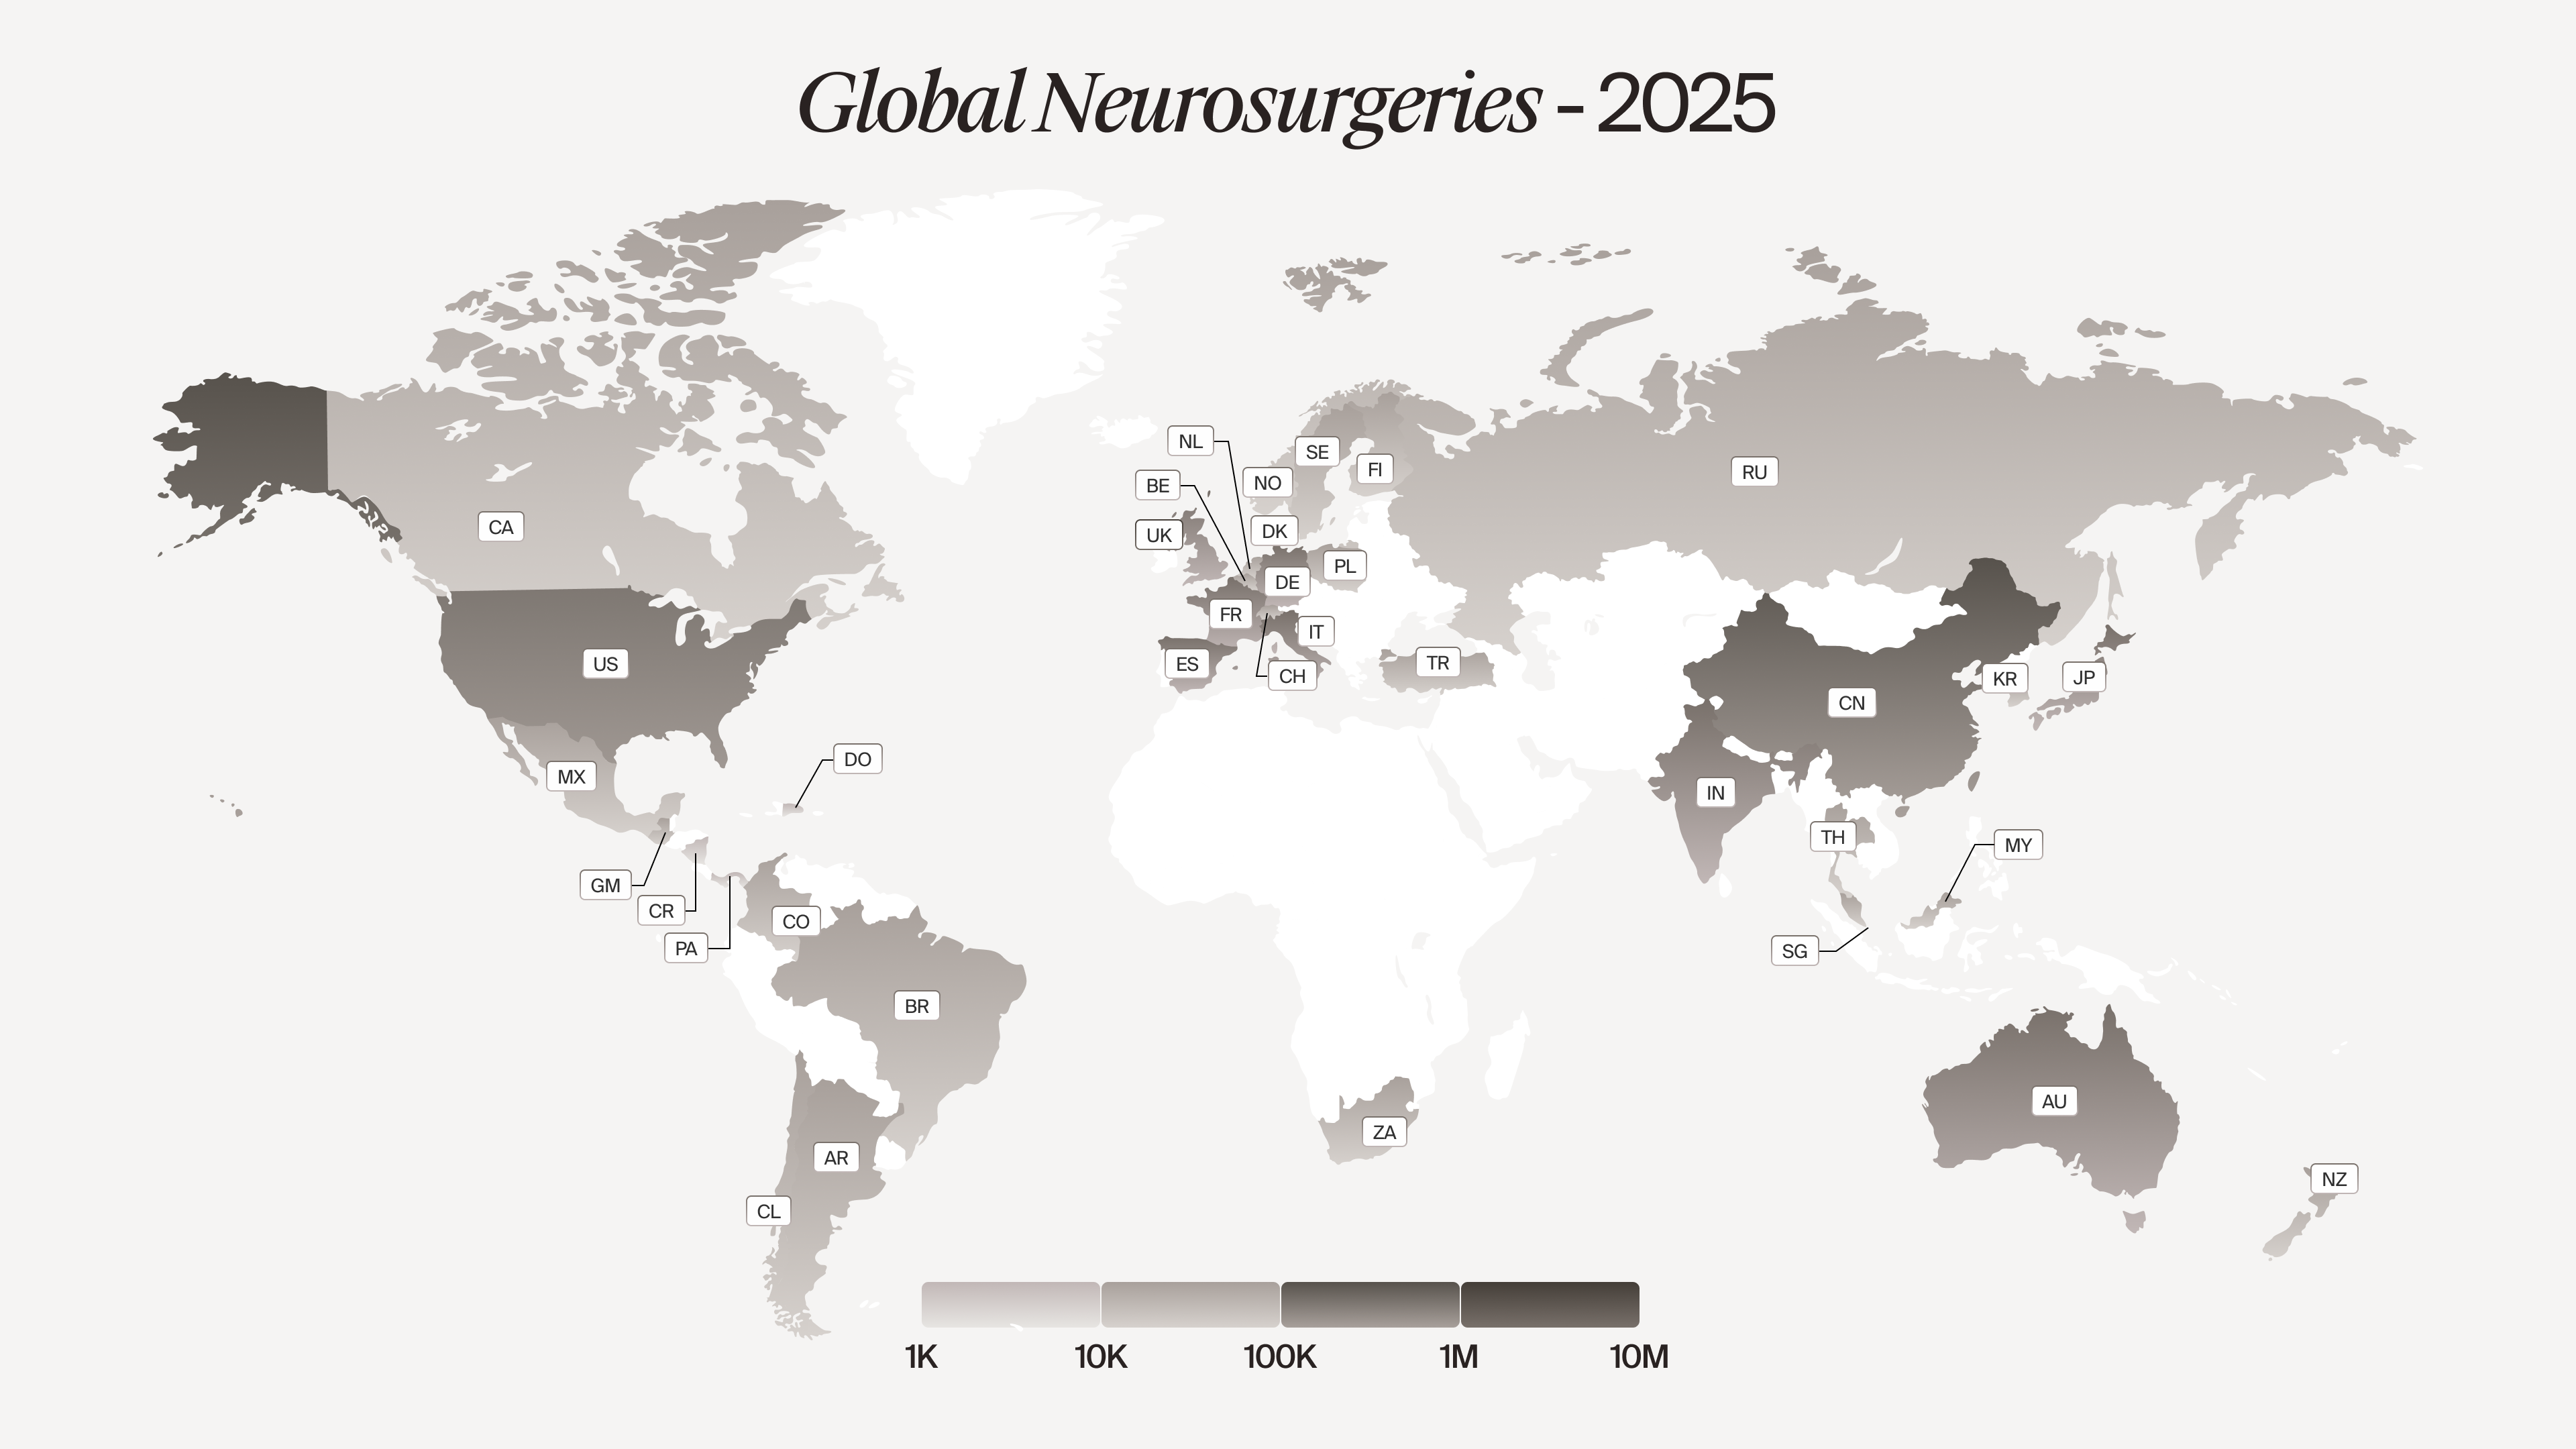
Within the platform, users can view procedure volumes for each neurosurgical procedure globally or segmented by
country. This feature provides a comprehensive view of the data and allows for granular insights into both
regional and global surgical trends.
Procedures covered in our Neurosurgical Procedure Volume Database include:
Surgeries for Traumatic Brain Injuries
Vascular Lesion Surgeries
Vascular Lesion Coil Procedures
New Shunt Placements
Open Pituitary Tumor Surgeries
Revision Shunt Surgeries
Endoscopic Pituitary Tumor Surgeries
Endoscopic Third Ventriculostomies
Diagnostic Ventricular Endoscopies
Open Intracranial Tumor Surgeries
Endoscopic Intracranial Tumor Surgeries
Functional Neurosurgeries
Cranioplasties, Duraplasties, and Combined Reconstructions
Global Neurosurgical Procedure Volumes
| Procedures in 2024 (000s) | CAGR (2023-2030) | |
| Global | 7,218 | 1.50% |
| United States | 2,817 | 2.26% |
| Canada | 42.79 | 3.09% |
| Germany | 506.56 | 2.08% |
| China | 936.08 | 8.80% |
| Mexico | 70.56 | 2.93% |
| Switzerland | 18.26 | 1.85% |
| Spain | 299.09 | 3.68% |
| United Kingdom | 233.40 | 4.25% |
| Italy | 383.17 | 3.82% |
| France | 373.57 | 1.60% |
| Poland | 33.04 | 1.53% |
| Belgium | 51.37 | 1.75% |
| Denmark | 31.53 | 1.89% |
| Finland | 9.60 | 1.65% |
| Sweden | 28.23 | 1.88% |
| Norway | 9.37 | 2.02% |
| Netherlands | 71.63 | 1.42% |
| Japan | 293.43 | 3.84% |
| Russia | 77.32 | 7.38% |
| Turkey | 46.00 | 4.55% |
| Malaysia | 23.67 | 3.34% |
| Thailand | 60.55 | 2.31% |
| Singapore | 8.33 | 3.16% |
| South Korea | 42.94 | 2.90% |
| India | 373.15 | 5.91% |
| Brazil | 72.66 | 4.37% |
| Colombia | 23.91 | 2.06% |
| Argentina | 29.39 | 0.65% |
| Chile | 12.89 | 2.04% |
| South Africa | 26.08 | 2.42% |
| Australia | 149.29 | 3.05% |
| New Zealand | 12.85 | 1.31% |
| Guatemala | 8.58 | 1.61% |
| Panama | 3.11 | 1.72% |
| Costa Rica | 3.64 | 1.67% |
| Dominican Republic | 5.49 | 1.46% |
| Caribbean | 29.73 | 0.92% |